Browser SOA / HTTP Debugger
Browser SOA / HTTP Debugger
We just released a tool, which we developed internally to be able to debug complex HTTP based SOA stacks (REST). It offers the same listening capabilities like Wireshark, but displays the HTTP requests in a far more readable way and makes it easy to reproduce single requests.
Wireshark is great for debugging network issues, but if there are multiple requests between different webservices involved, it gets really, really hard to follow those requests. Since we are helping quite some of our clients with more complex SOA architectures, which sometimes require debugging, we came up with a tool that works better for us: BSOAD. And we just push'ed it to Github.
There are other solutions available, which are based on (HTTP) Proxies. Sadly it is not always easy to reconfigure all involved services to use those proxies, and the proxy-configuration might get tedious with a lot of services. Also solutions using stuff like LD_PRELOAD are often a hassle to maintain. Since BSOAD is based on TCPDump, which logs the TCP packets originating directly from the kernel this is an entirely non-invasive solution.
Is your API really REST? Get a Qafoo expert on board to help you designing, testing and prototyping it!
The Goal
The goal of BSOAD is to provide you with a good overview on all HTTP interactions in the system you are inspeciting over a given time span. In addition, it should be easily possible to exactly reproduce single requests for debugging purposes. This is what BSOAD gains you.
The User Interface
 BSOAD overview
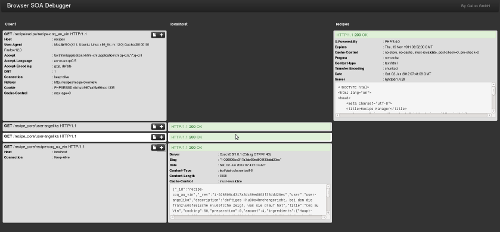
The data for each host involved is printed in its own column and each row is a client-server-interaction. New requests are prepended to the top. This does not only work for two HTTP back ends, as shown in this case, but virtually for an unlimited amount of HTTP back ends. For example, in some of our projects it occurs that 6 or 8 services talk to each other. The shown example is a trivial app with a CouchDB backend, which obviously also shows up (localhost).
You want to introduce automated testing, continuous integration and more? Hire the experts for an individual training on-site at your company!
The separation of back ends proved really useful to easily locate problems in certain services. The different ranges of HTTP status codes are of course highlighted in different colors, so that you can easily spot errors.
You can then bring up detailed information for a single requests by clicking the "+" button. That will show you all the request and response headers as well as the raw bodies. Pull requests for content-type specific body formatting / highlighting are highly welcome.
 BSOAD request
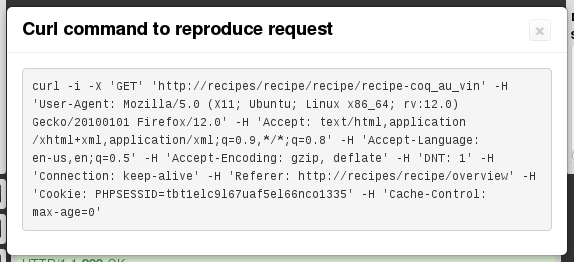
If this is not enough, BSOAD creates a curl shell command for you, to reproduce the exact request:
 Curl command
Executing the command on the shell will replay the exact request. This can be really useful to reproduce and fix an error in one of your back ends. Of course, request replay also works for POST requests, or others containing a request body -- even the command might get longish ;).
Currently BSOAD supports HTTP (1.0 and 1.1) and ethernet TCP IPv4 and IPv6 communication. You are welcome to add support for other protocols.
The Software
The full software is available on Github. The README also conatins a rough description how the software works. We release this without any warranties and hope it works for you as well as it works for us. Pull requests are very welcome.
Usage
To use BSOAD on localhost, execute something like:
tcpdump -l -i lo 'tcp and (port 80 or port 8983 or port 5984)' -w - | bsoad | bsoad-bdogThis will dump all HTTP, Solr and CouchDB interactions using their respective default ports on localhost. You may of course configure other devices, ports and use the common TCPDump filtering capabilities -- check out the TCPDump manpage for this.
Important is the -w - flag for TCPDump so that the raw binary output is written to stdout.
You can always let TCPDump write into some file and pipe that into bsoad later, of course.
The default bsoad executable logs all requests (and parsing errors) to STDERR and passes a filtered set of requests on to the browser viewer. You can configure this behaviour by creating your own customized bsoad executable. See src/bin/bsoad for details. In the bsoad executable you could also configure other command generators (other then the default curl one) if you like.
